Aussie threatened birds declined by 59 per cent over the past 30 years

Australia’s threatened birds declined by nearly 60 per cent on average over 30 years, according to new research that reveals the true impact on native wildlife of habitat loss, introduced pests, and other human-caused pressures.
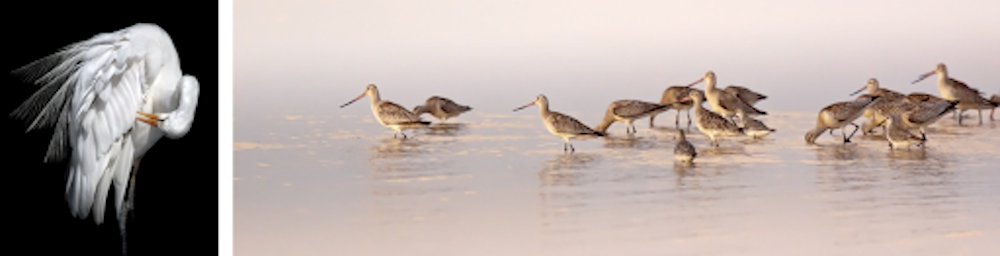
Alarmingly, migratory shorebirds have declined by 72 per cent. Many of these species inhabit our mudflats and coasts on their migration from Siberia, Alaska or China each year.
These concerning figures are revealed in our world-first Threatened Bird Index. The index, now updated with its second year of data, combines over 400,000 surveys at more than 17,000 locations.
It’s hoped the results will shed light on where conservation efforts are having success, and where more work must be done.
Bringing conservation efforts together
The index found a 59% fall in Australia’s threatened and near threatened bird populations between 1985 and 2016.
Migratory shorebirds in South Australia and New South Wales have been worst hit, losing 82 per cent and 88 per cent of their populations, respectively. In contrast, shorebirds in the Northern Territory have increased by 147 per cent since 1985, potentially due to the safe roosting habitat at Darwin Harbour where human access to the site is restricted.
Habitat loss and pest species (particularly feral cats) are the most common reasons for these dramatic population declines.
Many of Australia’s threatened species are monitored by various organisations across the country. In the past there has never been a way to combine and analyse all of this evidence in one place.
The Threatened Species Recovery Hub created the index to bring this information together. It combines 17,328 monitoring “time series” for threatened and near threatened bird species and subspecies. This means going back to the same sites in different years and using the same monitoring method, so results over time can be compared.
Over the past year the amount of data underpinning the index has grown considerably and now includes more than 400,000 surveys, across 43 monitoring programs on 65 bird species and subspecies, increasing our confidence in these alarming trends.

About one-third of Australia’s threatened and near threatened birds are in the index but that proportion is expected to grow. As more quality data becomes available, the index will get more powerful, meaningful and representative. For the first time Australia will be able to tell how our threatened species are going overall, and which groups are doing better or worse, which is vital to identifying which groups and regions most need help.
Finding the trends
Trends can be calculated for any grouping with at least three species. A grouping might include all threatened species in a state or territory, all woodland birds or all migratory shorebirds.
The 59 per cent average decrease in threatened bird relative abundance over the last 30 years is very similar to the global wildlife trends reported by the 2018 Living Planet Report. Between 1970 and 2014, global average mammal, fish, bird, amphibian and reptile populations fell by 60 per cent.
One valuable feature of the Threatened Species Index is a visualisation tool which allows anyone to explore the wealth of data, and to look at trends for states and territories.
For instance, in Victoria by 2002 threatened birds had dropped to a bit more than half of their numbers in 1985 on average (60 per cent), but they have remained fairly constant since then.
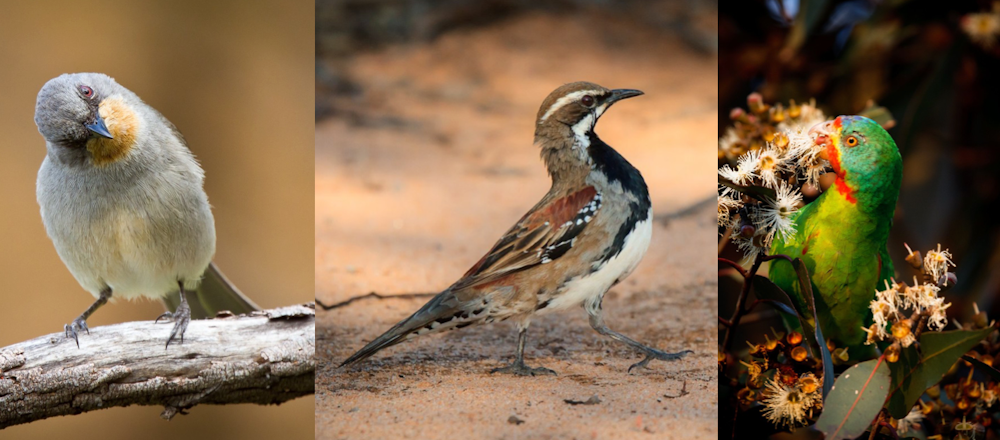
We can also look at different bird groups. Threatened migratory shorebirds have had the largest declines, with their numbers down by more than 72 per cent since 1985. Threatened terrestrial birds, on the other hand, have decreased in relative abundance by about 51 per cent between 2000 and the year 2016, and show a relatively stable trend since 2006.
Making the index better
The index is being expanded to reveal trends in species other than birds. Monitoring data on threatened mammals and threatened plants is being assembled. Trends for these groups will be released in 2020, providing new insights into how a broader range of Australia’s threatened species are faring.
This research is led by the University of Queensland in close partnership with BirdLife Australia, and more than 40 partners from research, government, and non-government organisations. Collaboration on such a scale is unprecedented, and provides extremely detailed information.
The index team are continuing to work with monitoring organisations across Australia to expand the amount of sites, and the number of species included in the index. We applaud the dedicated researchers, managers and citizen scientists from every corner of the country who have been assembling this data for the nation.
We’d also like to hear from community groups, consultants and other groups that have been monitoring threatened or near-threatened species, collecting data at the same site with the same method in multiple years.
The Threatened Species Index represents more than just data. Over time it will give us a window into the results of our collective conservation efforts.
This article also received input from James O’Connor (BirdLife Australia) and Hugh Possingham (The Nature Conservancy).
Elisa Bayraktarov, Postdoctoral Research Fellow in Conservation Biology, The University of Queensland and Jaana Dielenberg, Science Communication Manager, The University of Queensland
This article is republished from The Conversation under a Creative Commons license. Read the original article.