Australians aren’t equal when it comes to climate change vulnerability

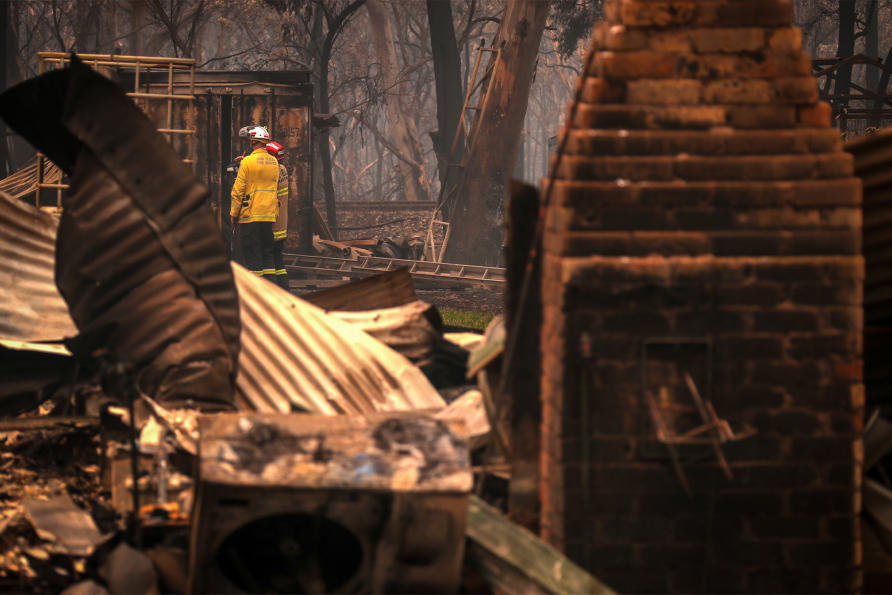
It feels like Australia is in a never-ending cycle of climate-related disasters. In December 2023 alone we saw flooding inundate Northern Queensland, bushfires blaze through north-west New South Wales, and forecasts of thunderstorms and bushfires put South Australian residents on alert.
Extreme weather and climate events are becoming more frequent and intense in Australia. So much so that in 2020 Australia was in the top ten regions globally for economic losses resulting from climate-related disasters.
The risk of harm from climate change and extreme weather events is not just a function of the intensity of the hazard or exposure. Communities and their residents have characteristics that make them either more susceptible or more resilient.
This is why we created a new Social Vulnerability Index – to describe the nature of the social vulnerability some communities face in preparing for climate change in Australia.
This can be used with climate hazard maps to identify areas most at risk of health harms.
Understanding a community’s vulnerabilities and capacity to adapt is critical for adaptation planning and building the resilience of communities. The most recent assessment report from the Intergovernmental Panel on Climate Change (IPCC) noted that the inability to identify social vulnerability at a local and urban level is a critical barrier to climate adaptation planning.
Our Index is designed to help communities, emergency response planners and public health officials identify strategies that best support communities before, during and after climate and weather disaster events.
For example, is a community’s population older than average for Australia and therefore requires specific forms of support? Are more people in the community employed in occupations which would be directly affected by climate-related disasters? Do people have access to the vehicles, communication facilities and health services that support them through disasters?
This information can be used to create targeted adaptation plans and efforts to increase climate resilience.
Our index is based on international evidence. We first conducted a large scoping review of social vulnerability indicators linked to the health impact of climate change and extreme weather events like heatwaves, heavy rains, storms and bushfires.
We focused on 230 studies covering 15 themes – having assessed 2,115 articles in total. We identified 113 indicators of social vulnerability to the health effects of climate change.
Our team selected indicators from this set with good data to generate an Australian index of social vulnerability by area (using Australian Bureau of Statistics – Statistical Area Level 2).
The map shows an area’s composite Social Vulnerability Index as well as individual vulnerability domains which include:
- Demographics,
- household composition,
- socioeconomics (income, employment, education and social development),
- language and literacy,
- natural and built environment,
- access to services,
- infrastructure (communication, transportation, emergency services, health services and government services),
- existing health condition and care needs,
- social connection,
- housing precarity,
- dwelling condition and
- livelihood or occupation.
Higher scores indicate higher vulnerabilities.

Social vulnerabilities and disaster resilience capacities differ within communities, across societies and through time. Similarly, the exact composition of social vulnerabilities in each domain differ across areas.
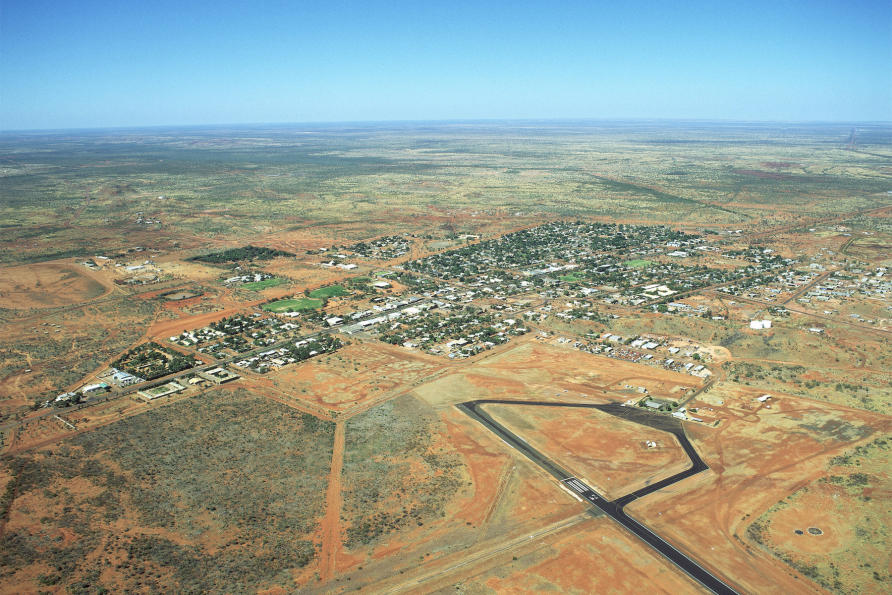
While remote areas have relatively higher social vulnerability, many metropolitan regions are also susceptible to climate risks. Each area’s risk is driven by different social domains and disasters.
Social vulnerability in remote areas is largely driven by socioeconomic factors like higher unemployment rate, lower household income, lack of internet access, homelessness and area socioeconomic disadvantages.
Pockets of high social vulnerability in metropolitan centres are often due to demographic and housing factors – like having a greater proportion of older people, more single or group households, more artificial surfaces, greater housing affordability stress and older building stock.
Which communities are more vulnerable?
We identified 113 factors through our scoping review, but a lack of data precludes many of these social vulnerability measures from our index.
Our team is doing further work to include more factors and verify their links to Australian population health; but by way of example here are six factors that have strong evidence and good national data about their impact on vulnerability.
Demographics
Communities with larger populations of older people and children face increased risk of climate impacts.
Some of the more vulnerable areas are in the Central and Hills regions of Adelaide, the Central Coast and Mid North Coast of New South Wales, Latrobe in Gippsland, Victoria, and Moreton Bay North in southern Queensland.
Socioeconomic vulnerability
Areas with low rates of employment and labour participation, lower household income, lower area socioeconomic status and greater income inequality have less capacity to cope and adapt.
The Northern Territory outback, Wide Bay in Queensland, and northern and western Tasmania are noticeably susceptible.
Health
Areas are more vulnerable in terms of their care needs when there are larger populations of people with disability and activity limitation.
Some of those areas are located in Australia’s north west, Mid North Coast, and the South West of Sydney in NSW, the Australian Capital Territory, as well as Logan and Beaudesert, south of Brisbane.

Livelihood
When considering livelihood vulnerability, sensitive areas are more dependent on primary production and construction, like the Darling Downs-Maranoa region of southern Queensland, the South East region of South Australia and the Australian Capital Territory.
Housing
Housing insecurity has reduced resilience in areas including the Australian Capital Territory, parts of Sydney (the City and Inner South, the Outer West and the Blue Mountains) and Inner Melbourne.
Service access
Areas where vulnerabilities are high due to poor access to services and facilities like State Emergency Service (SES) provisions, hospital beds, access to vehicles and the distance to main roads include Northern Territory outback, South Australian outback, as well as the City and Inner South of Sydney.
The aim of our index is to help understand Australia’s vulnerabilities when it comes to climate change – providing information to help us adapt, plan and build resilience for the future.
The Social Vulnerability Index is freely available to communities to identify what support they need for climate resilience.
This article was first published on Pursuit, and reproduced here with permission. Read the original article.