Citizen scientists huge help in creating Australian Frog Atlas: reveals true distributions of our frogs
It may seem obvious but to conserve a species, we need to know where it occurs. Typically the first step is to document where a species is, but that is not as simple as it sounds. It can take a lot of time and resources for biologists to find just a few individuals of some species because they can be really difficult to detect! Secondly, even if a species is detected, it can be tricky to identify accurately – some species look remarkably similar. As a result, existing species occurrence datasets are often limited in size and they can also vary greatly in their accuracy. This can be particularly problematic for amphibians.

© Jodi Rowley
Amphibians have the dubious honour among vertebrates of being both the most-threatened and the poorest-known group. Many species of amphibian are incredibly difficult to detect, making the task of collecting enough observations to understand their distributions daunting, to say the least. Others might be relatively easy to find, but make up for it by being virtually indistinguishable, making identification by sight alone nearly impossible. The result? A hodgepodge of scant information – some accurate and some not – informing our current understanding of amphibians’ distributions.
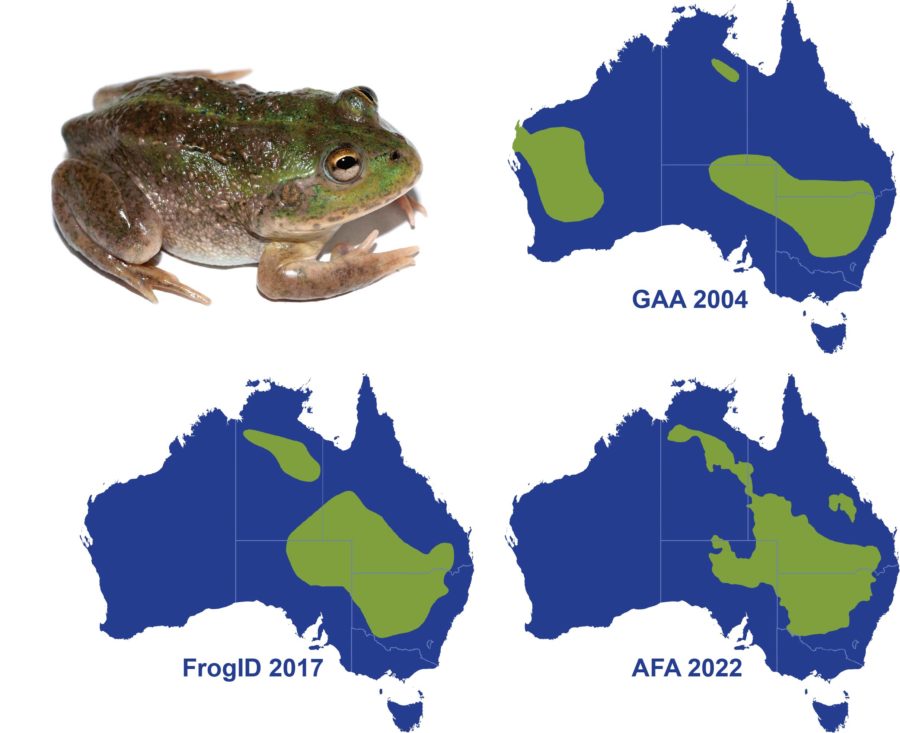
Distribution maps for frogs involve a lot of guesswork and are often out of date. Maps produced by the Global Amphibian Assessment (GAA) are broadly considered the best amphibian distribution maps in the world, but these were created nearly 20 years ago. In addition, they no longer reflect our current understanding of frog distributions.
This is a problem for amphibian conservation. Distribution maps are often used to determine the impact that threats like wildfires and floods have on species. Maps of species distributions are overlaid with maps of floods or fires to prioritise conservation actions. The use of inaccurate maps in processes like this severely limits how accurately we understand threats, and therefore our ability to mitigate them.

© Australian Museum
Australia’s frogs deserve better distribution maps, and thanks to tens of thousands of people across Australia recording calling frogs with their phones, we now have the occurrence data to do this. Since the launch of the Australian Museum’s FrogID project in 2017, there has been a rapid increase in frog occurrence records in Australia. FrogID is a free, app-based citizen science project and in just four and a half years, over 650,000 records have been gathered by the project – which is more than half the number of the frog records we had for Australia prior.
Two things about FrogID data make them reliable, and ultimately useful for updating Australia’s frog distribution maps: frog identifications are made from audio recordings, rather than photographs, and are validated by experts. While many Australian frogs may look very similar, almost all have a distinctive call, making identifications easier and often much more reliable by sound than sight. Once citizen scientists submit their recordings of calling frogs, frog experts listen to them and confirm the ID. This has resulted in a sharp increase in high quality Australian frog occurrence data. Using FrogID data, along with other frog occurrence records, we have produced the Australian Frog Atlas: updated, detailed distribution maps for all 248 species.
The Australian Frog Atlas (AFA) is by far the most comprehensive set of amphibian distribution maps for Australia – possibly of any continent! Its fine-scale individual species maps include some important range extensions and reductions. For example, the range of the Crucifix Frog (Notaden bennettii) was extended west at two separate points by 100 km and 172 km, with both range extensions informed by FrogID records. On the other hand, while Sloane’s Froglet (Crinia sloanei) has historical records spanning from Queensland to Victoria, many of these are misidentifications. As a result, the species is only truly known from a much smaller area, which has implications for its conservation status.
The AFA also includes our most detailed look yet at how amphibian species richness is distributed across Australia. Our species richness heat map shows that up to 45 frog species co-occur in the Wet Tropics of Queensland. Conversely, there are two areas where frogs have never been scientifically documented, including 27,000 km2 of the Simpson Desert. They may really be absent, but there is a chance that some frogs are there, so if you’re in one of these areas, keep the FrogID app handy and listen out for any calling frogs!

© Australian Museum
It is our hope that these maps will have significant outcomes for frog conservation in Australia. For this reason, we are making them, and their associated Geographic Information System (GIS) files, freely accessible. We hope that they are useful to researchers, land managers, and conservation practitioners in understanding the ecology and conservation of Australia’s frogs, and will assist in land use planning. These maps have also been incorporated into the FrogID app.
The power of collective action for biodiversity is great. With the invaluable help of citizen scientists across Australia, we’re starting to really understand where frogs are, and what they need. Who knows? The records that inform the next Australian Frog Atlas may be in the millions!
This article is republished courtesy of the Australian Museum.