Cyclone tracking: Australia’s worst storms
SUMMER IN AUSTRALIA means trips to the beach, long days in the sunshine and family holidays for most but, for those in the disaster zone, it can mean battening down the hatches, securing large items and preparing for the worst; Australia’s tropical cyclone season lasts November-April each year.
To prepare for these natural disasters, forecasting is important. In much the same way that indigenous Australians once kept an eye on the size of waves to predict incoming tropical cyclones, nowadays, meteorologists’ eyes are glued to satellite images. “Prior to satellite imaging, forecasting was a very difficult task,” says Weather Channel meteorologist Alex Zadnik. “Satellite imagery and complex numerical models have greatly improved the accuracy of cyclone forecasting.”
Tracking tropical storms
From satellite data, meteorologists identify regions of convection (heat transfer) over the ocean. In particular they look for ‘Madden-Julian oscillations’ (bands of low atmospheric pressure that originate off the east coast of central Africa, then travel across the Indian Ocean and over northern Australia), which kick-start tropical cyclone development.
To build a more detailed outlook, weather stations based in the Pacific and Indian oceans send ground observations to the Bureau of Meteorology (BOM). “We hope a weather station might be in a cyclone’s way, but in most cases they are not,” BOM senior forecaster Angelina Prasad says. “We look at the overall cloud pattern to deduce the central pressure and wind speed.” A full prediction of a cyclone’s intensity and direction – allowing a margin of error, and accurate up to about 48 hours in advance – may then be drawn up.
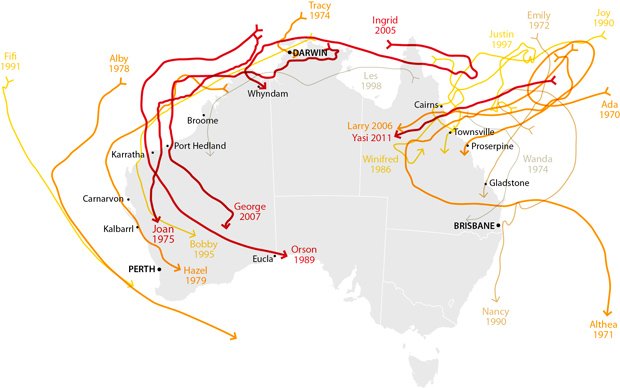
Bureau of Meterology tropical storm/cyclone ratings:
Category 1 (grey)
Up to 125 km/h
Winds can cause damage to shrubs, small trees and unanchored mobile homes.
Category 2 (brown)
125-164 km/h
Trees are blown down and major damage occurs to doors, windows and roofing materials.
Category 3 (yellow)
165-224 km/h
Large trees are blown down, small buildings suffer structural damage and mobile homes are destroyed.
Category 4 (orange)
225-279 km/h
Some road signs are blown down, and major damage occurs to buildings (especially to roofs, windows and doors).
Category 5 (red)
280+ km/h
Trees are uprooted, windows shatter, small buildings are overturned, and structural damage occurs to large buildings.
RELATED STORIES